@Sano
Made a very crude start with some mortality numbers. Unfortunately, I can't find adjusted averages, so this comparison will have to do. The 2018 numbers, are the numbers from the time of the flu epidemic in that year, which was a really bad one (9400 deaths). This seemed the most appropriate to go with, in order to gauge the severity of the COVID-19-epidemic. I adjusted the 2018 numbers to account for population growth (17,4 now vs 17,2 million 2 years ago). All the cursive numbers are indicative of a flu epidemic (which is also still going on right now, though slowly dying out), the bolded numbers indicate the COVID-19-epidemic.
First thing you'll notice is we're, again, two weeks behind. The second thing you'll notice that week 12 is the first week that we went over the 2018 numbers. That week, we had, to date, because those numbers are still not definitive, 338 deaths attributed to COVID-19. Third thing you'll notice, is that the maximum amount of weekly deaths during the 2018 flu-epidemic, was week 10 with 4140; for week 13 2020 they're expecting ~4200 deaths. Nothing too shocking so far.
Here are the numbers:

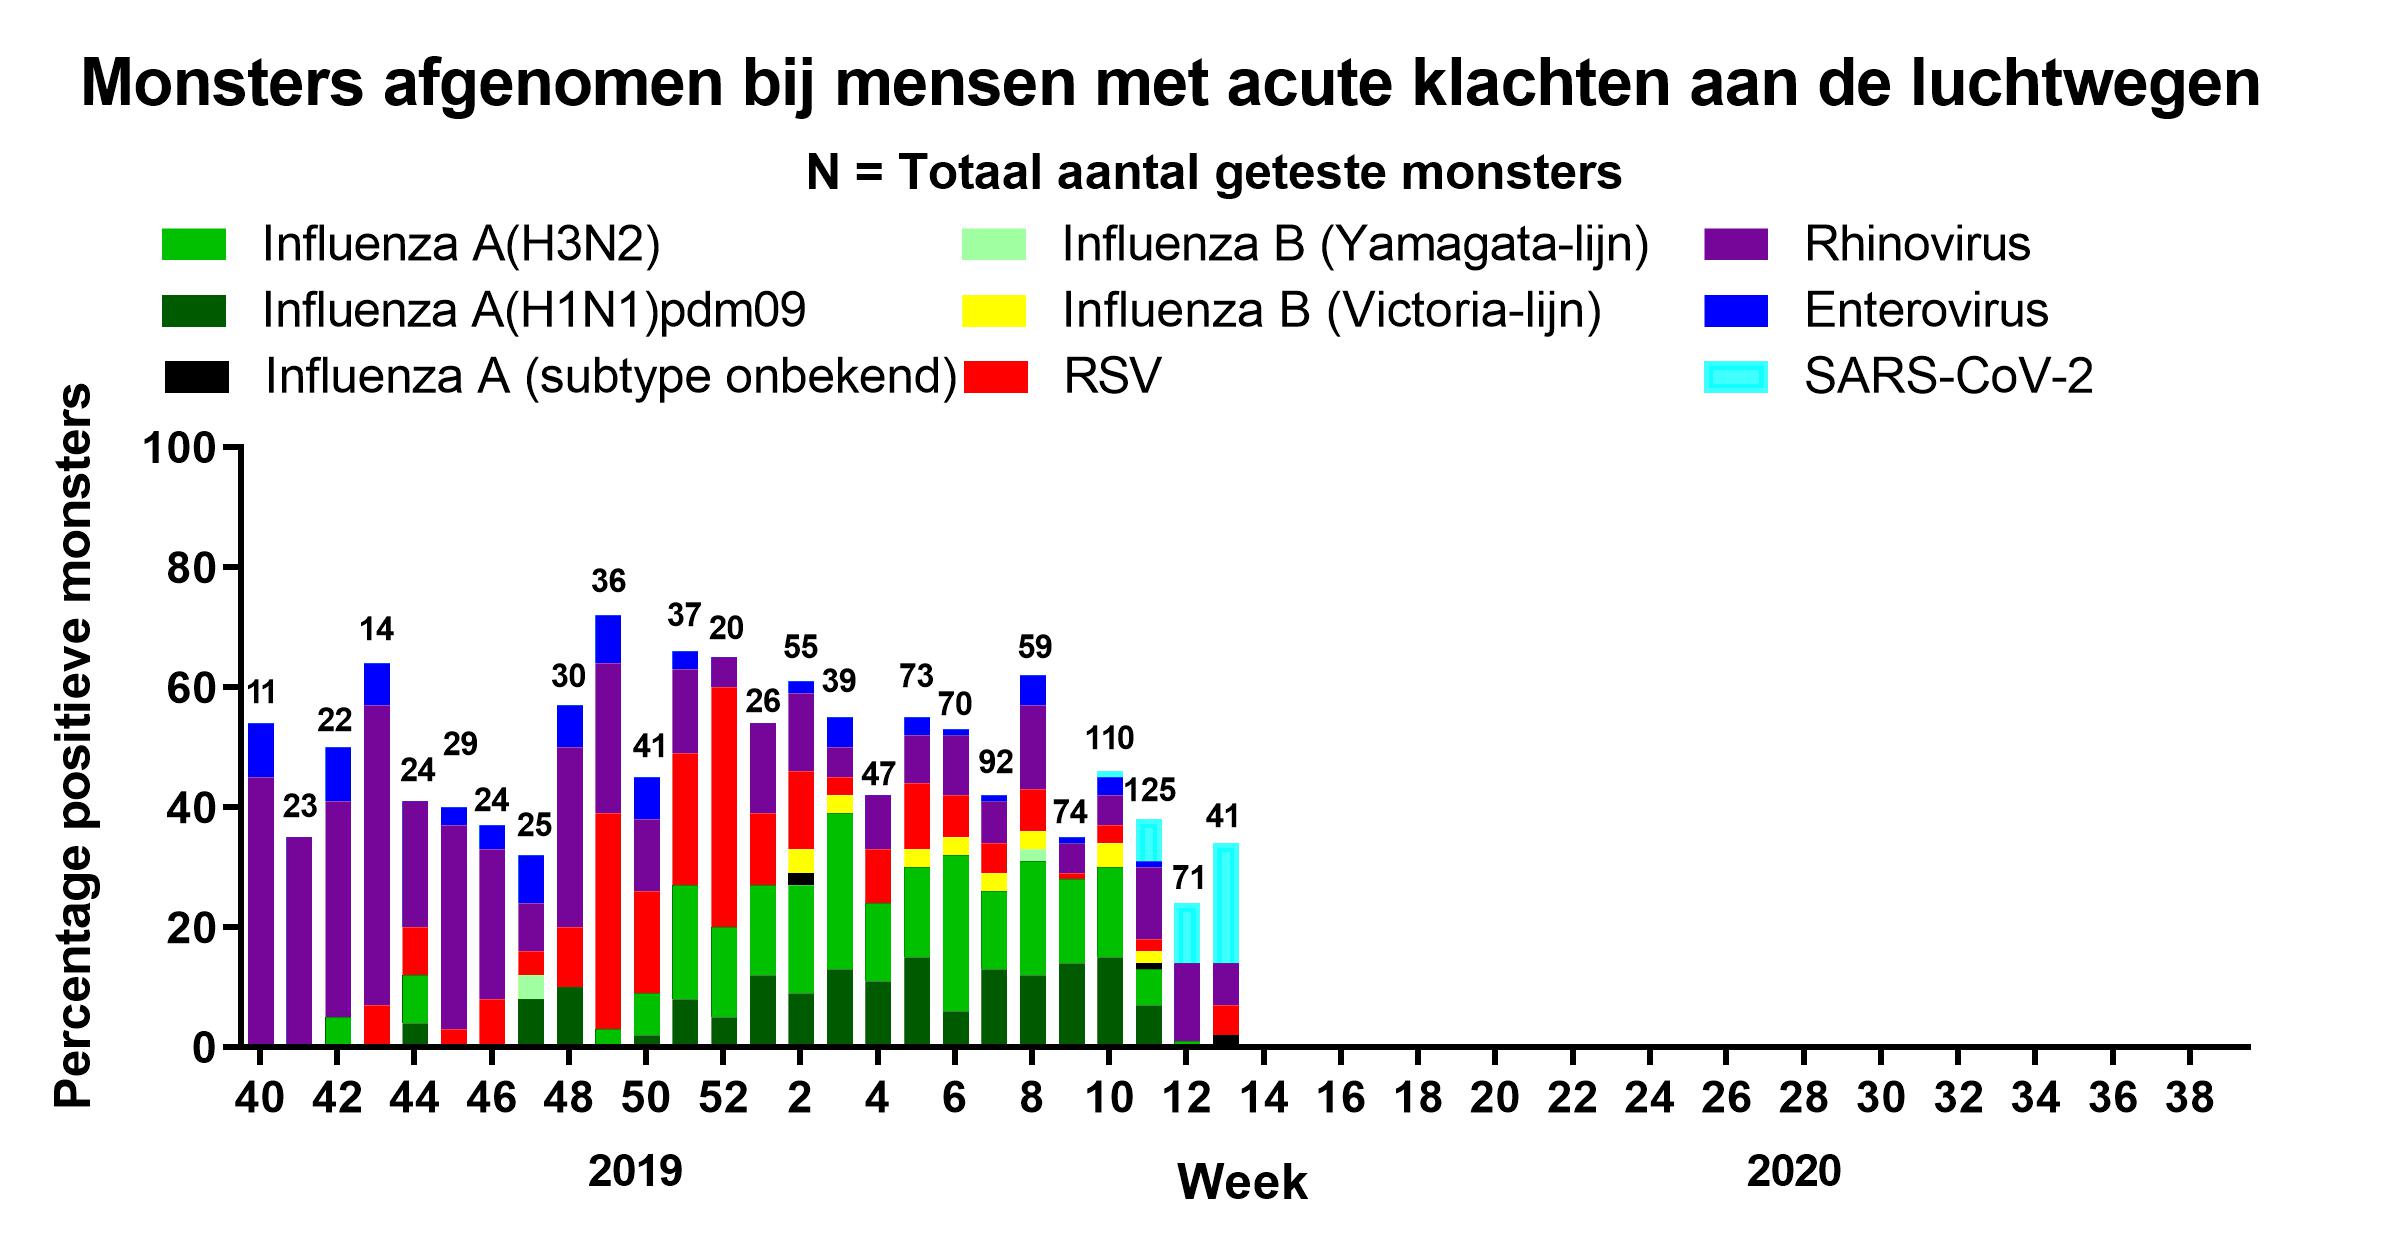
Now, one more thing I have to add; as the cursive numbers in 2020 indicate, and as I said before, we're still dealing with a flu-epidemic as well. There is no breakdown, i.e., the number of flu-related deaths is unknown (at this moment). But take a look at the graph below. The title reads: Samples taken from people with acute respiratory issues.
Next is says: N = Total of tested samples.
X-axis reads: Percentage of positive samples.
As you'll immediately notice, only starting in week 13 does SARS-CoV2 start exceeding influenza-type and other viruses.
Now, to draw a conclusion. I got none. I'm even more confused now.
You got any bright ideas?")
Made a very crude start with some mortality numbers. Unfortunately, I can't find adjusted averages, so this comparison will have to do. The 2018 numbers, are the numbers from the time of the flu epidemic in that year, which was a really bad one (9400 deaths). This seemed the most appropriate to go with, in order to gauge the severity of the COVID-19-epidemic. I adjusted the 2018 numbers to account for population growth (17,4 now vs 17,2 million 2 years ago). All the cursive numbers are indicative of a flu epidemic (which is also still going on right now, though slowly dying out), the bolded numbers indicate the COVID-19-epidemic.
First thing you'll notice is we're, again, two weeks behind. The second thing you'll notice that week 12 is the first week that we went over the 2018 numbers. That week, we had, to date, because those numbers are still not definitive, 338 deaths attributed to COVID-19. Third thing you'll notice, is that the maximum amount of weekly deaths during the 2018 flu-epidemic, was week 10 with 4140; for week 13 2020 they're expecting ~4200 deaths. Nothing too shocking so far.
Here are the numbers:
Now, one more thing I have to add; as the cursive numbers in 2020 indicate, and as I said before, we're still dealing with a flu-epidemic as well. There is no breakdown, i.e., the number of flu-related deaths is unknown (at this moment). But take a look at the graph below. The title reads: Samples taken from people with acute respiratory issues.
Next is says: N = Total of tested samples.
X-axis reads: Percentage of positive samples.
As you'll immediately notice, only starting in week 13 does SARS-CoV2 start exceeding influenza-type and other viruses.
Now, to draw a conclusion. I got none. I'm even more confused now.
You got any bright ideas?
Last edited: