And so are the days of our lives. This ties in very closely with the co incidences in the video I shared where the planning was shown to be forward planned far before covid was a thing.
I cannot recommend this video enough, I've listened to it twice in part(+20m) and the third time the entire vid.
More so if you're American I cannot overstate how important the information is.
- Usually so not to creat great walls of text I'll give a headline or if a critical piece of information that as well. Obviously my opinions are the bonus package because I'm not just witty, moderately intelligent, hard working but also I have to admit my biggest attribute is my modesty.
BUT as I'm not that credentialed I prefer to argue with the opinions of my educational betters, hence the links.
Global influence that took “just a few hours” to build

pandauncut.substack.com
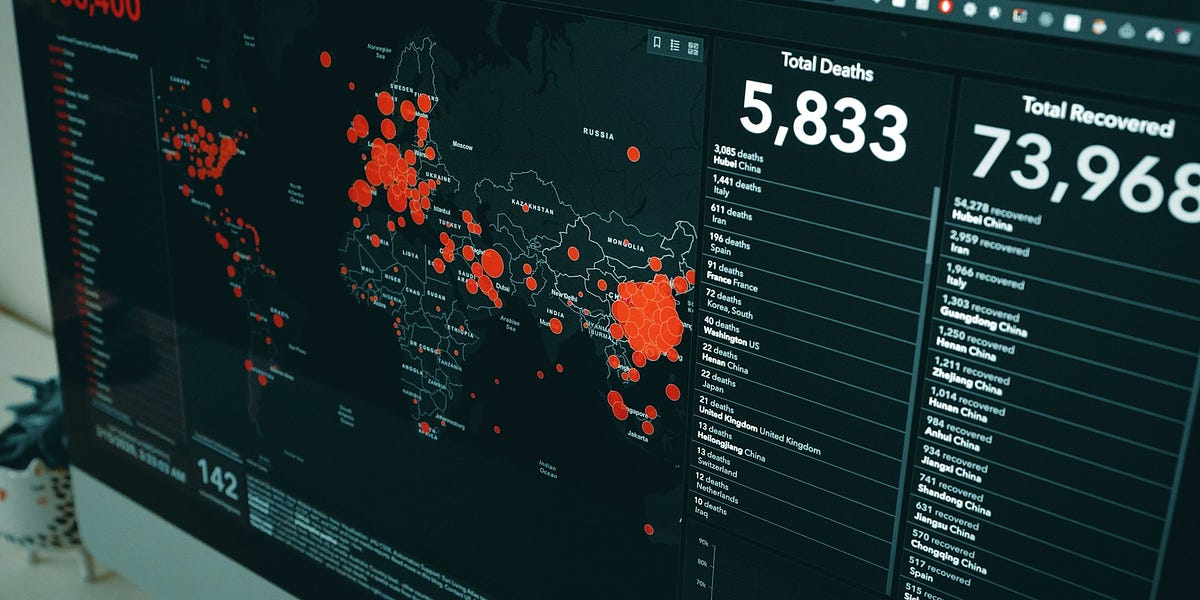
"The Dashboard that Ruled the World
Global influence that took “just a few hours” to build"
"There are multiple events that happened in January 2020 that are, to put it mildly, peculiar. One of them is that only 23 days after China reported that they had found a few cases of an “unknown pneumonia” in the city of Wuhan, three people in Baltimore Maryland launched a dashboard that was designed to track the number of cases and deaths of this disease in every country in the world. All three were connected with the Department of Civil and Systems Engineering at John Hopkins University (JHU). In their own words, the dashboard “was developed to provide researchers, public health authorities, and the general public with a user-friendly tool to track the outbreak as it unfolds” [1]. Along with the dashboard they also maintained a public data repository of cases and deaths [2]."
- Like the faulty pcr tests and then the rat tests, billions on hand. Just another coincidentally of course like the pandemic trial run in 2019 that matched the Plandemic exactly.
"The January 22 launch happened so early on in the Covid timeline that the first WHO situation report had only been released the preceding day, and the term “Covid” had not even been coined yet. In that first WHO report it was announced that “282 confirmed cases of 2019-nCoV have been reported from four countries including China” [3]. Total cases outside of China were only four, and there had been zero deaths. In fact, only six deaths were officially linked to the virus by this date, and all of them were from Wuhan. For comparison purposes and to put things into perspective, the norovirus is estimated to infect 685 million people and cause 212,000 deaths every year [4]. We are not aware of a norovirus dashboard anywhere in the world. "
- Seems legit and not like an excuse at all OR a preplanned and funded preparation.....
"Odd as it might be that a team at JHU chose to create and launch a dashboard for an unnamed disease despite such low numbers of cases and deaths in so few countries, there are possible explanations for why they did so. Only 3 months earlier JHU had hosted Event 201, a “training tabletop exercise… based on a fictional scenario” of a novel coronavirus causing a global and deadly pandemic [5]. Furthermore, the lead author of the dashboard (Professor Lauren Gardner) is a specialist in modelling infectious diseases. Notwithstanding what these facts might suggest, the dashboard was, at least according to their own testimony, the result of a “spur-of-the-moment” decision and took “just a few hours” to build [6].
- Lol just a few hours yet
"Within two months of its launch, the website was reportedly being “accessed 1.2 billion times per day,” [10] or nearly half the traffic of the internet giant Google. Within two years it had been cited by medical researchers in more than 8,500 articles [11].
“The Hopkins dashboard has become a ubiquitous and trusted reference point, cited by U.S. federal agencies and major news sources” [12].
- Thats one fuck ton of traffic, hell of a load on an off the cuff and “spur-of-the-moment” bit of work.
- mmmm modelling, what could possibly go wrong. Of course there hasn't been any issues raised on data integrity either....
"Given how much influence the JHU dashboard exerted on the world during the Covid event, it is appropriate to examine it in some detail. In particular, we here discuss some of the difficulties of obtaining data in real-time, the sources they used to obtain that data, how they put data into their system, the language barriers involved in the process, and, finally, the role that computer simulations may or may not have played."
- Obviously facts can be inconvenient
"Obtaining Data in Real-time
Even with the help of modern computers, it typically takes many months (or even years) to produce reliable mortality data."
.
.
"If it currently takes two or three years for a federally funded organisation such as StatsCan to publish mortality data, how was it possible for JHU to get Covid death data in real time?"
- How indeed. If there is one thing they can guarantee is that the data is definitely showing safe and effective
"It is equally challenging to produce statistics about one particular pathogen or virus. For instance, seven months after the 2017/2018 flu season had ended, the CDC in the US was still only providing estimates for cases and deaths."
- mmmm thats not going to sell a plandemic though. We need data like we needed chinese videos of collapsing asians, just toppling in the streets.
"If it takes months or years to obtain mortality and case data for the flu, how was it possible to obtain data for Covid in real time? If it was not possible to do this in 2019, how did it suddenly become possible to do it in 2020?"
-Obviously they "moved with the speed of science".........
"Likewise, the Human Mortality Database, which tracks mortality by country, is regularly ten years behind for many countries [15]. How then did JHU expect to be able to plot Covid deaths for every country in the world in real time? More crucially, how did they possibly update their dashboard “every 15 minutes”? [1, 16]"
- that speed of science really is speedy. Nothing else but hard work and dedication to the cause of scientific integrity.
"Data Sources for the JHU Dashboard
Good data depends on good sources, and the only way to understand how the JHU dashboard obtained their data in real time is to examine their sources"
- I have a sneaking suspicion that China will be needed because their attention to detail and integrity in politics, manufacturing, science and data is well recognised internationally.
"Of significance is that their sources changed over time. Initially, their primary data source was “DXY, an online platform run by members of the Chinese medical community, which aggregates local media and government reports to provide cumulative totals of COVID-19 cases in near real time at the province level in China and at the country level otherwise” [1]. This source, therefore, was a combination of news and government reports."
- nothing stands for truth and justice like the Chinese communist party. Book me in the the jab clinics I'll take them all.
- it's frustrating that I cannot underline etc. because when I could do so I didn't mind the massive wall of text I used to do. Now as I'm stuck with using space between paragraphs its a bit of a shambles.
Also no point, a person that would read the link will do so and posting the entire links content just detracts from the information but......
"Eventually the team at JHU felt that DXY was taking too long to obtain and publish data, so they branched out to include other sources: “To identify new cases, we monitor various Twitter feeds, online news services, and direct communication sent through the dashboard.” As health agencies around the world set up their own dashboards, JHU incorporated them into their list of sources [2].
JHU therefore acknowledged three primary sources of information other than official government websites:
-Twitter feeds
-online news services
-direct communication sent to the dashboard
- so it turns put that the CCP weren't able to manufacture the data quickly enough so they did what any reputable data collection would do they source stories from twitter, online news and their second cousins beat friends roommate.
"Scraping the internet for news stories about Covid certainly has the potential to speed up the process of collecting data. Unfortunately, and beside the above named problems, it also introduces the possibility of a noise-amplifying feedback loop.
**************After all, if “major news sources” were trusting JHU for accurate data, how could JHU be getting their data from (potentially) the same news sources?"***************
- how indeed and what could possibly go wrong.
.
.
.
.
.
.
- a lot as it turns out but how could they have known about these potential problems when they knucked down for two hours and COINCIDENTALLY got this is place just in time......
- I'll leave John Hopkins because their dirty dealings alone in all this would take an entire thread but
"Worldometer as a Data source
JHU expressly mentions Worldometer as one of their sources [2]. Worldometer themselves confirm this fact, saying: “Our data is also trusted and used by… Johns Hopkins CSSE” [19]. In general, Worldometer uses computer simulations to report statistical information in “real-time.”
- mmmm computer simulations, what could possibly go wrong. They'll no doubt be as reliable and accurate as the modelling was....
- odd the world of meter uses prior history to guess the present and future numbers. Odd with a NOVEL coronavirus they could do these simulations. Obviously just another coincidence.
"Did Worldometer use computer calculations to determine Covid statistics in a manner similar to what they do for motor vehicle accidents? If they did (and because they could not know the yearly totals in advance), did they use epidemiological models rather than real deaths to estimate how many people were going to die that year from Covid? Neither question can be answered with certainty."
- It turns out they can type and confirm data with the speed of science as well.
"Inputting Data into the System
According to the Lancet article by Gardner et al, for the first ten days after the launch of the JHU dashboard, “all data collection and processing were done manually, and updates were typically done twice a day” [1]. From a logistical perspective this was doable since there were so few cases and only a few countries involved during this period of time.
Concerning accuracy of the data, they claimed that “
efore manually updating the dashboard, we confirm the case numbers with regional and local health departments…as well as city-level and state-level health authorities.” It has already been established, however, that neither Canada nor the US could produce either mortality or influenza data within a six month time frame. How then did not only Canada and the US, but eventually every country in the world, provide daily case and death counts that JHU could use for verification?
- MMMMMM this sounds like the potential for a negative feedback loop
"In an attempt to answer this last question, the websites of Statistics Canada were examined to see how they obtained their Covid data. It was found that StatsCan did the same as the JHU team did, for they also used “web scraping techniques to gather relevant data from a variety of websites on COVID-19” [23].
.
.
"The reply from StatsCan leaves one wondering if their information came from the JHU dashboard. Given how popular the JHU dashboard became, that it was expressly designed to enable health authorities to track the outbreak, that it was cited by US federal agencies, that it has been widely used by medical researchers, and that StatsCan scraped the web to obtain their data, it is quite likely that StatsCan did"
Amazing this speed of science, no corners cut, no stone left unturned, no one left behind....................

www.aussie17.com
 www.theepochtimes.com

 lionessofjudah.substack.com