I don't think you actually understand how tree ring data is used. The idea is to use old trees. The years can be mapped out because the ring pattern changes from summer to winter and the width of a ring is a proxy for temperature (more width, more growth, higher temperature). A 200 year old tree provides 200 years of data. The data can be correlated with another 200 year old tree that fell 150 years ago to provide 350 years of data. You will have to explain to me the relevance of trees forming during the growing season to obtaining a 200 year temperature record from a single tree because my only explanation is that you do not understand how tree ring data is collected. The oldest tree ring data goes back around a few thousand years, which allows for correlation with longer span ice core data. If you are claiming that the tree ring data is no good then how can the ice core data correlated with it be any good? Ice cores provided the proxy temperature data by which Milankovitch cycles were proposed. Are you questioning the existence of Milankovitch cycles? If you now accept tree ring data then there is a problem that tree ring data correlates with ice core data but not adjusted surface temperature data (the adjusted data that purports to show 1C warming in 100 years), tree ring data not showing the purported increase.
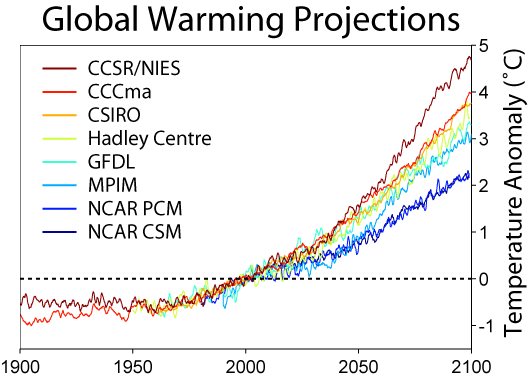
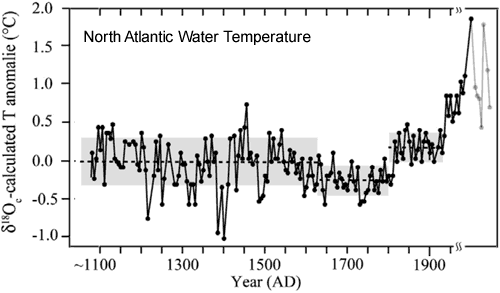
I keep mentioning Milankovich cycles because of its long duration. When you look at global temperature on a scale of thousands of years, you see that all of human civilization has existed in a narrow interglacial warming period that extends before the industrial revolution and these narrow warm periods have occurred cyclically even predating man's existence. Today's temperature is not outside of the temperatures seen repeatedly over a time span of hundreds of thousands of years.
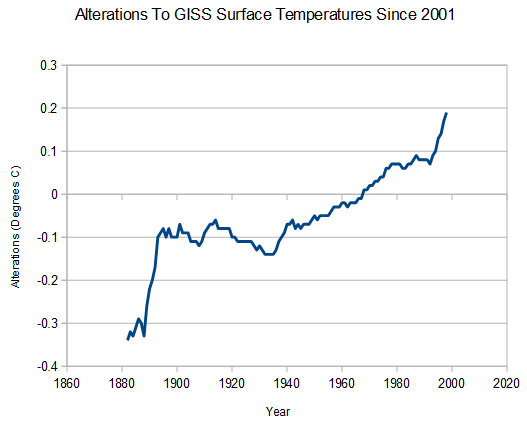
Here is the evidence of the data being adjusted. From:
https://data.giss.nasa.gov/gistemp/
"GISS homogenization (urban adjustment)
One of the improvements — introduced in 1998 — was the implementation of a method to address the problem of urban warming: The urban and peri-urban (i.e., other than rural) stations are adjusted so that their long-term trend matches that of the mean of neighboring rural stations. Urban stations without nearby rural stations are dropped. This preserves local short-term variability without affecting long term trends. Originally, the classification of stations was based on population size near that station; the
current analysis uses satellite-observed night lights to determine which stations are located in urban and peri-urban areas.
We maintain a running record of any modifications made to the analysis, available on our
Updates to Analysis page.
Graphs and tables are updated around the middle of every month using the
current adjusted GHCN and SCAR files. The new files incorporate reports for the previous month as well as late reports and corrections for earlier months."
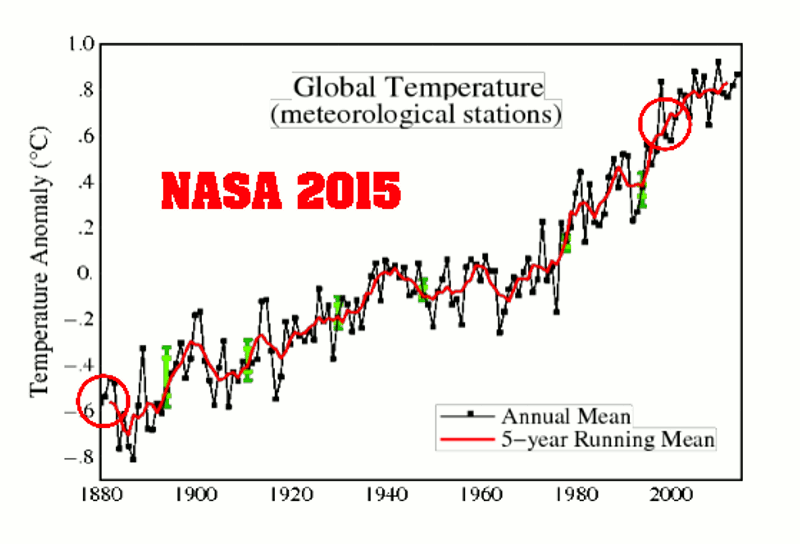
I am not aware of any unadjusted dataset that shows the claimed 1C increase in 100 years, and the data cannot be correlated with another dataset, such as tree ring data, but tree ring data can be correlated with ice core data. I challenge you to provide a surface temperature dataset that shows the 1C increase in 100 years and that has no adjustments to individual temperature readings.
Plus you have not addressed my point about error bars. The claim of a 1C increase in 100 years is made using an error bar of 0.1C, the same 0.1C today and 100 years ago. Does it seem reasonable to claim to know the global temperature within a tenth of a degree when you can't even get one dataset to correlate with another? Does it seem reasonable to you that the error in global temperature measurement is claimed to be the same today as it was 100 years ago?